
Motion · Creative systems · Performance
Designing with data
I was given the job of modernising how the design team worked. I led the move from scattered, largely analogue workflows to a connected, data-led system for planning, testing and learning from creative.
I built the workflows, Figma tools and shared libraries behind it, then used performance data to guide what we made next.
Data, not vibes.
Overview
A practical overhaul of how the team planned, found, tested and learned from creative.
Context
The creative workflow had outgrown the way it was being managed.
At Little Star Media, campaign work and useful learning were spread across folders, spreadsheets, Jira tickets and people’s memory. I was asked to modernise it.
My role
I owned the shift from scattered files to a shared system.
- Led the move to a data-led creative workflow
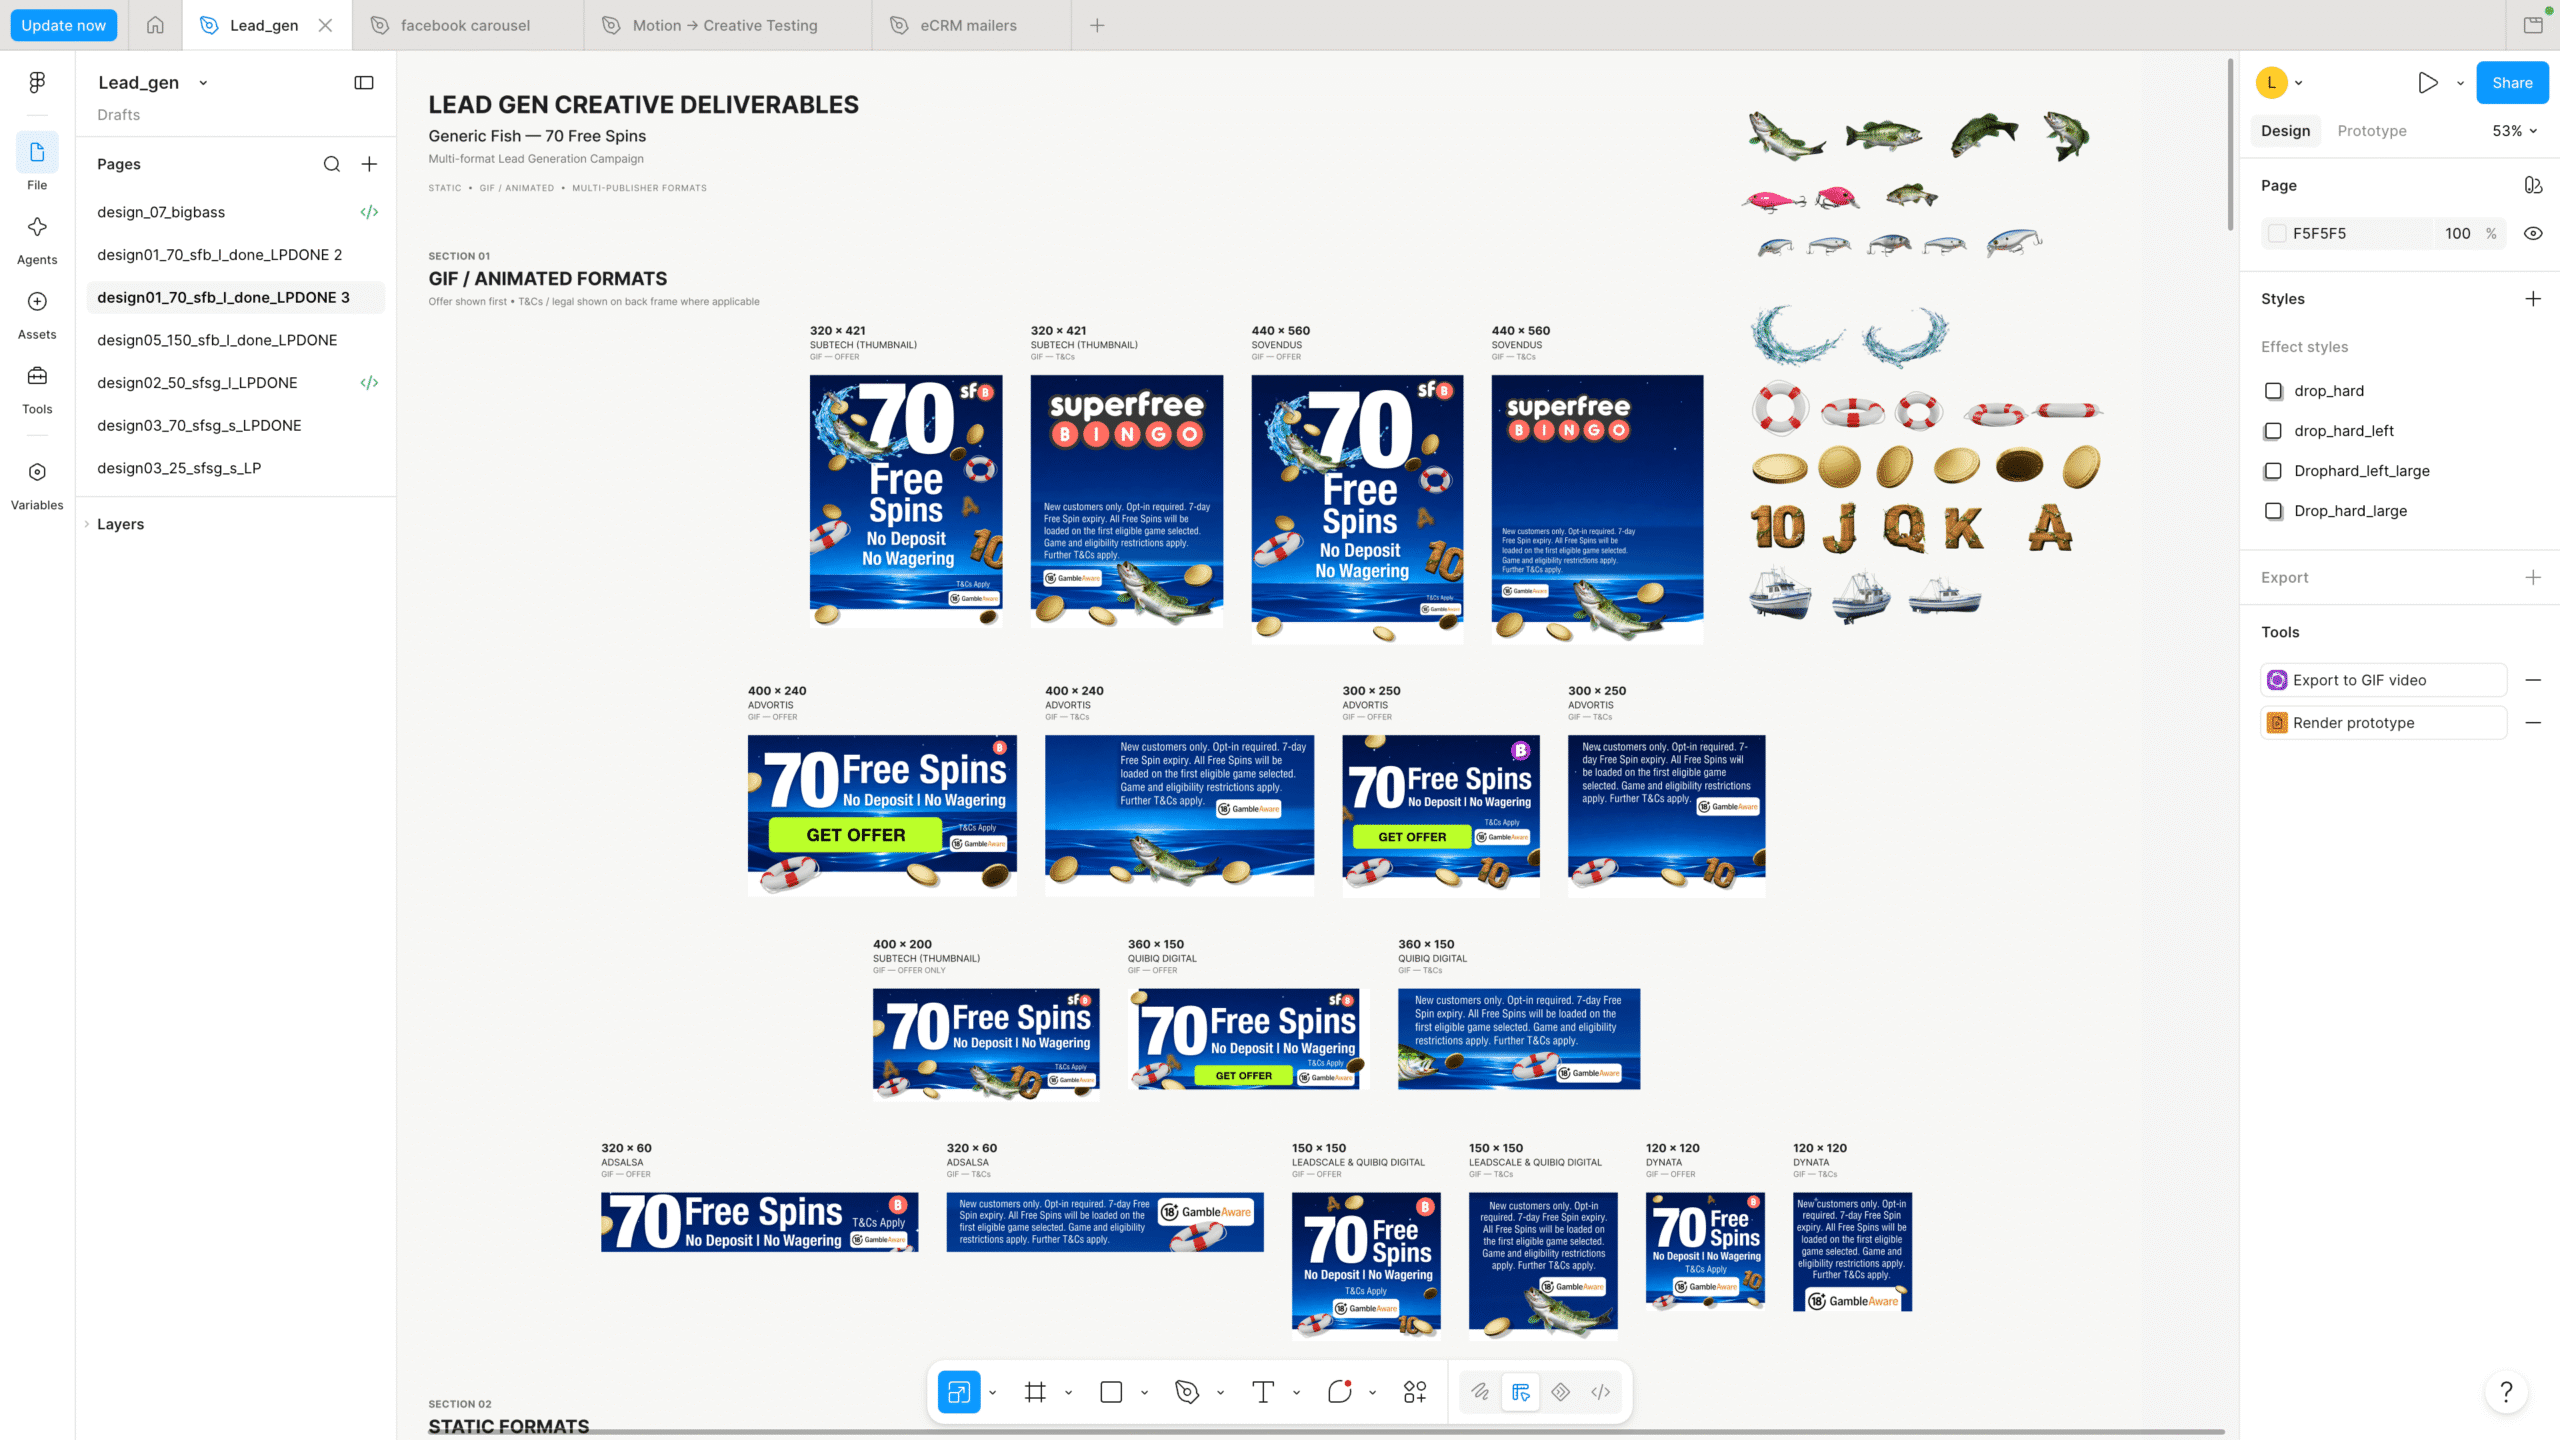
- Designed and built the Figma system
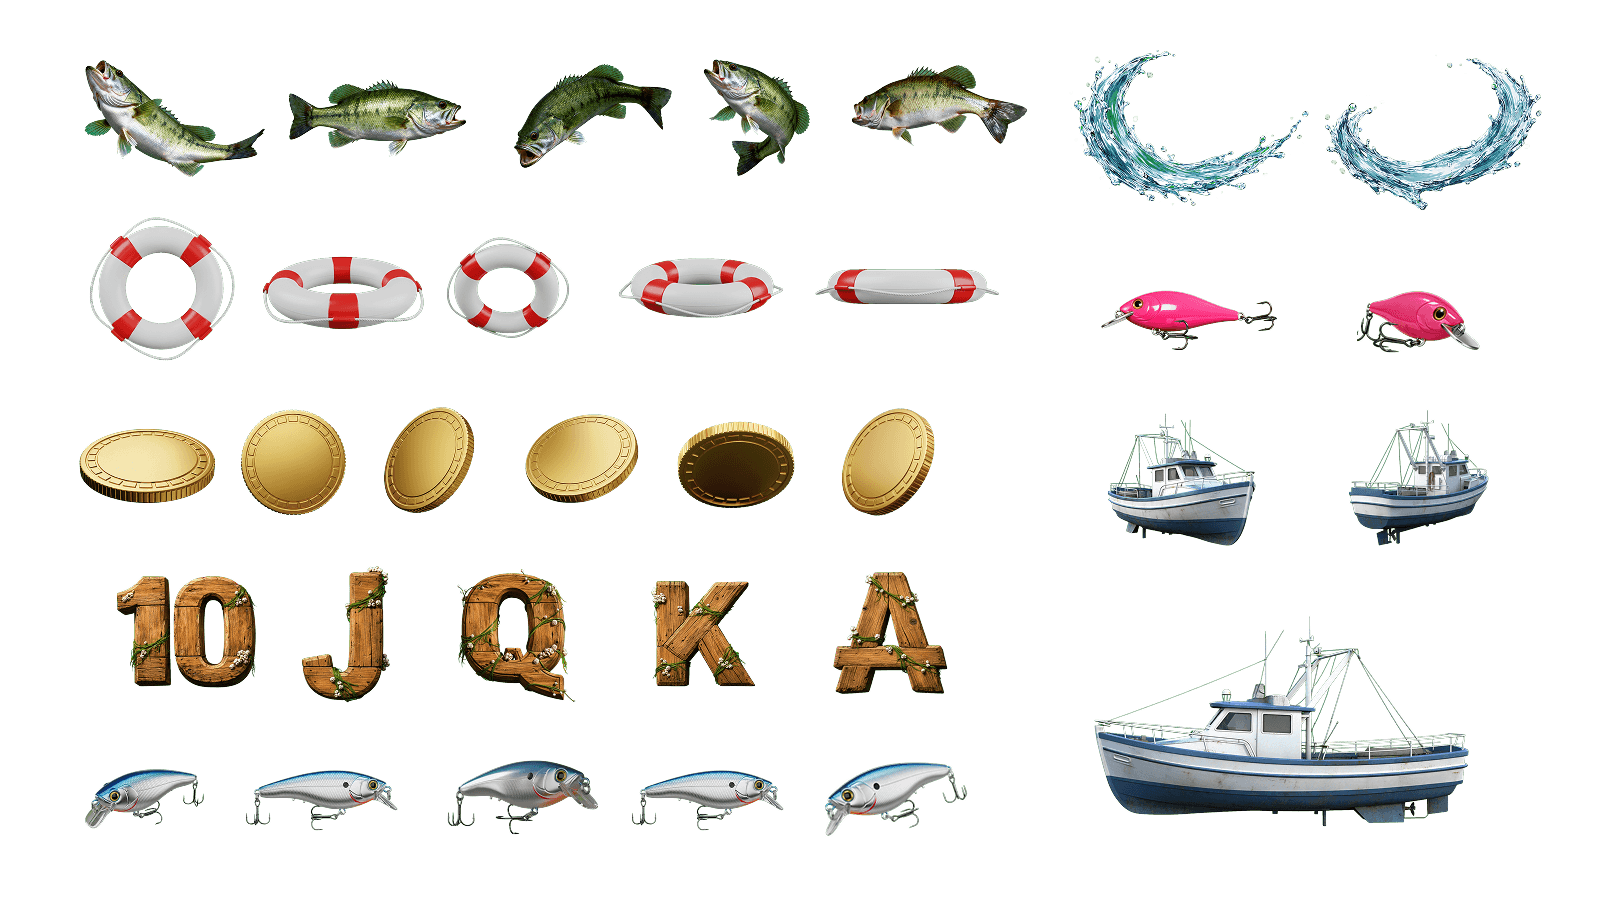
- Created the searchable creative library
- Created competitor, hypothesis-testing and data spaces
- Used performance learning to plan what the team made next
- Kept designing and animating campaign creative
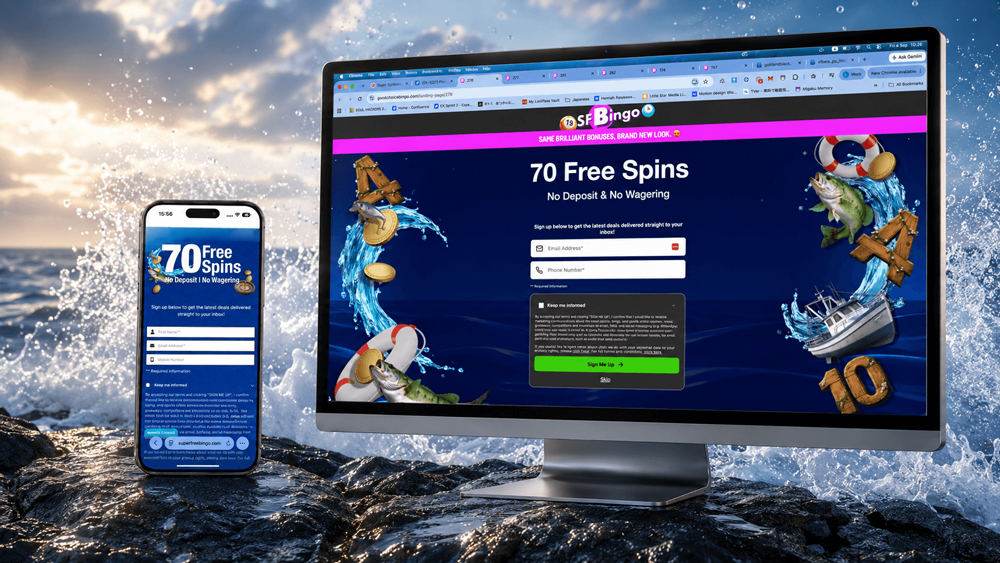
Campaign & motion
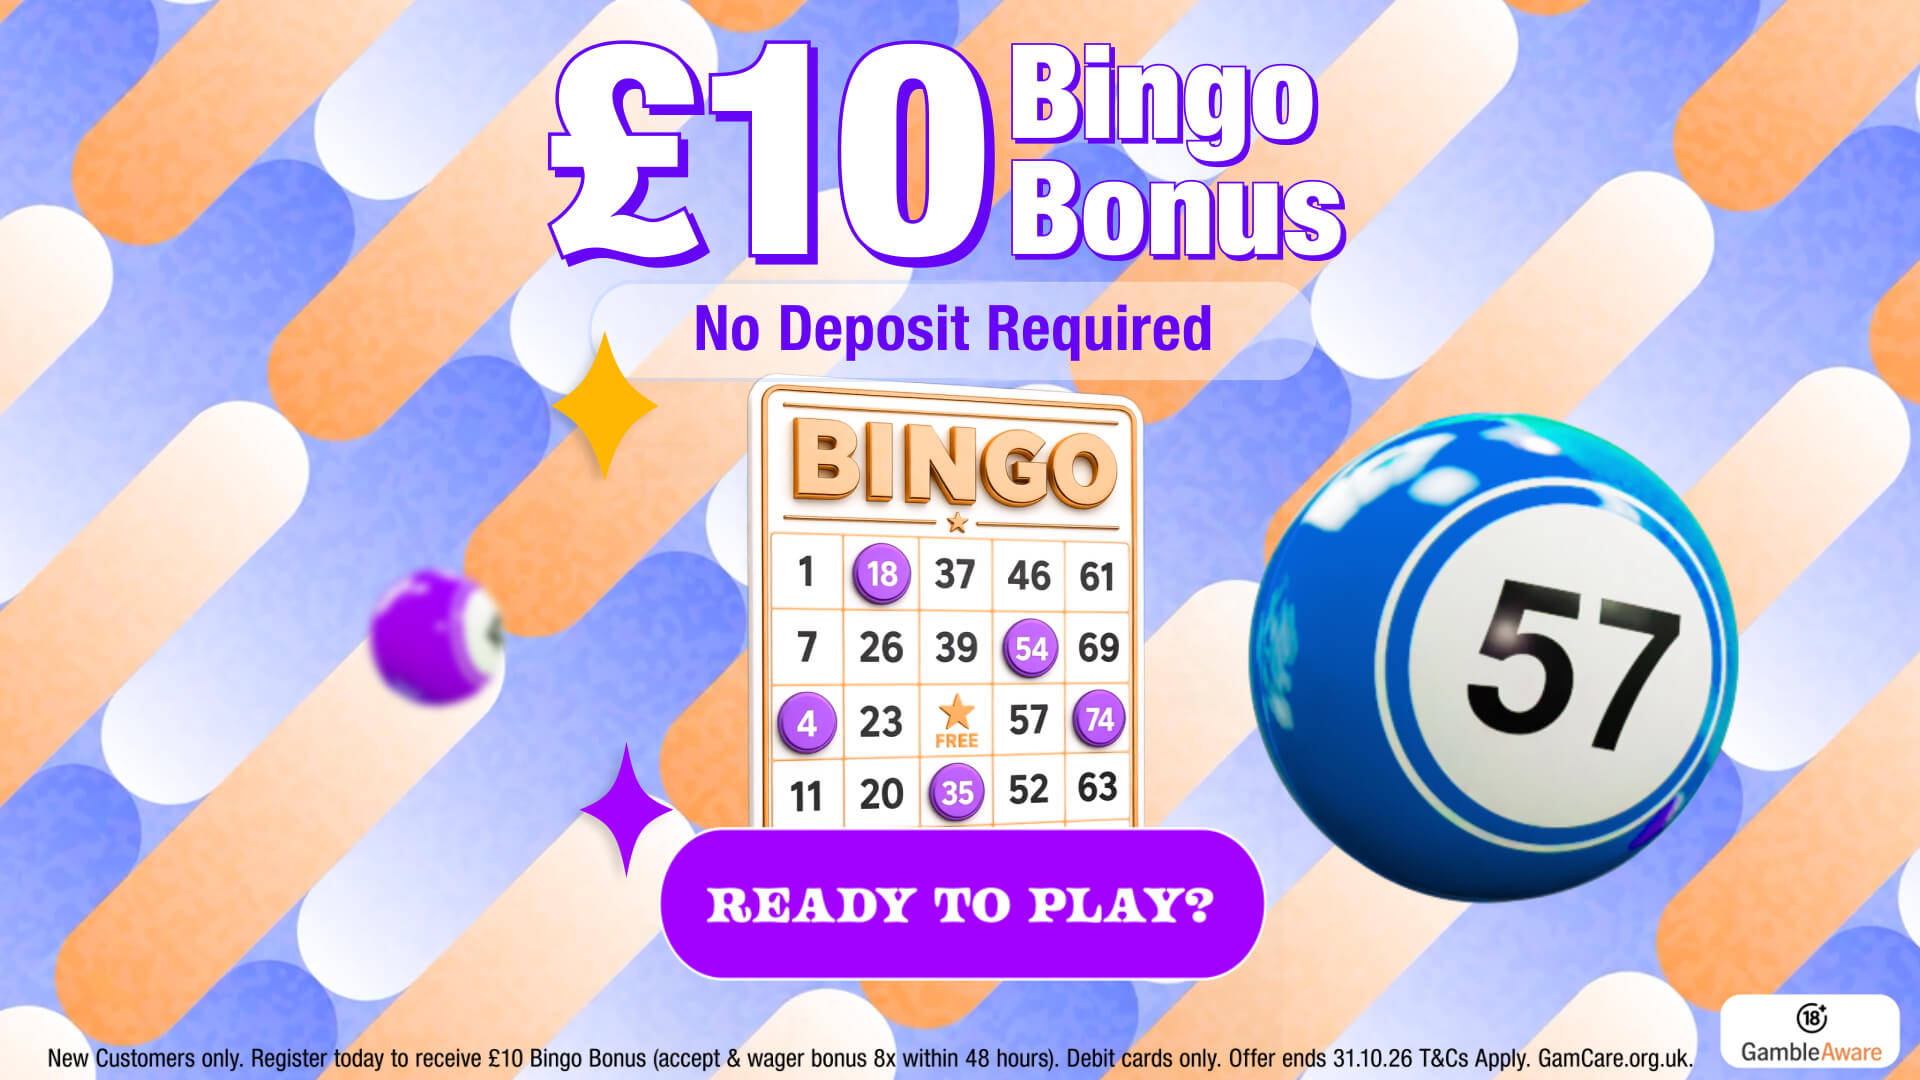
I kept designing and animating campaign work while building the system around it.
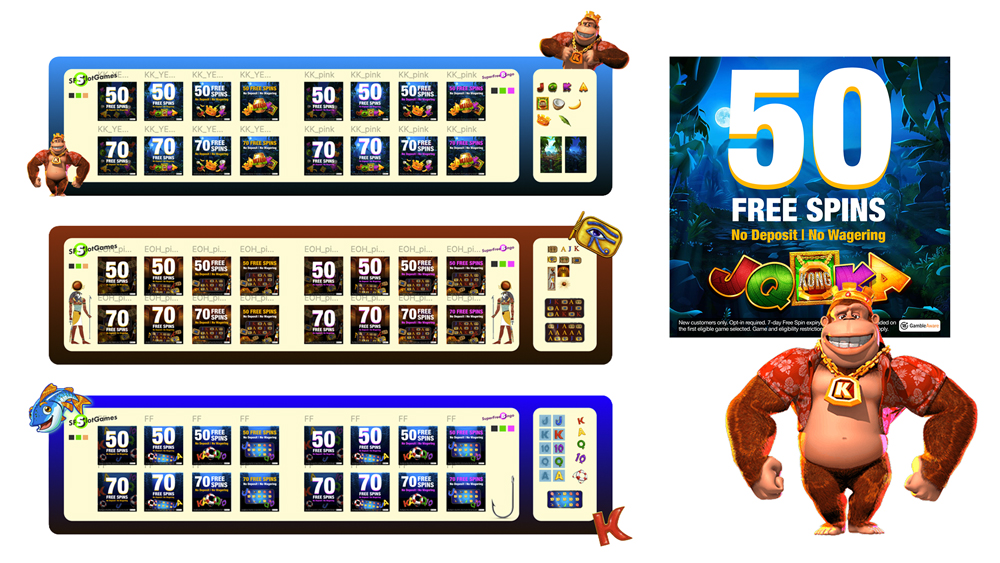
The system still had to make the work better.
I kept making motion and campaign creative myself, then used what we learned from each live piece to shape the next one.
Storyboarding & process
Pencil first, pixels later. It helps me see what the idea is actually doing.
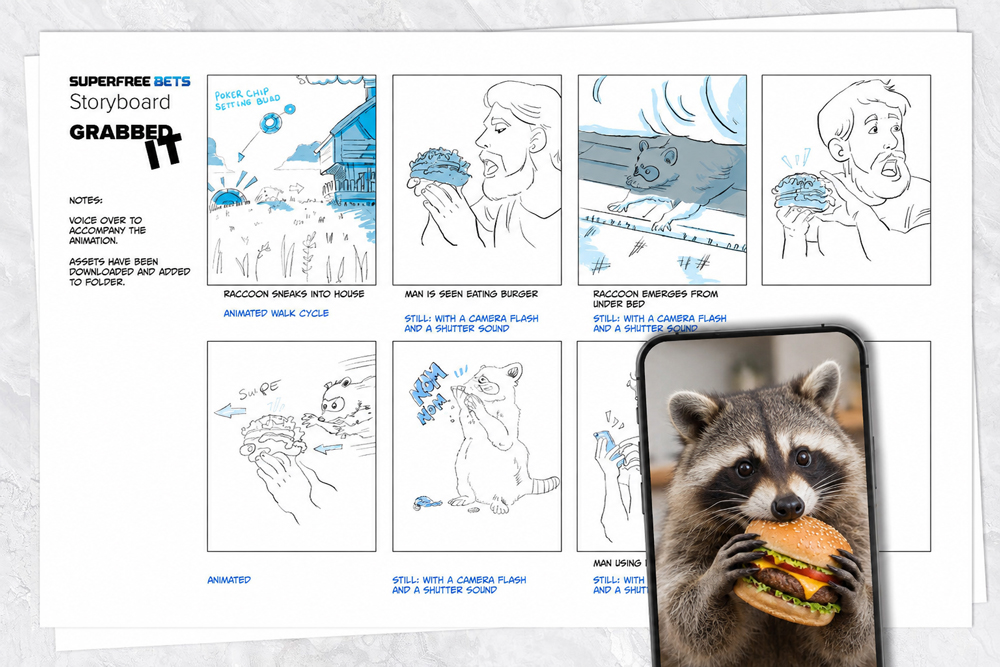
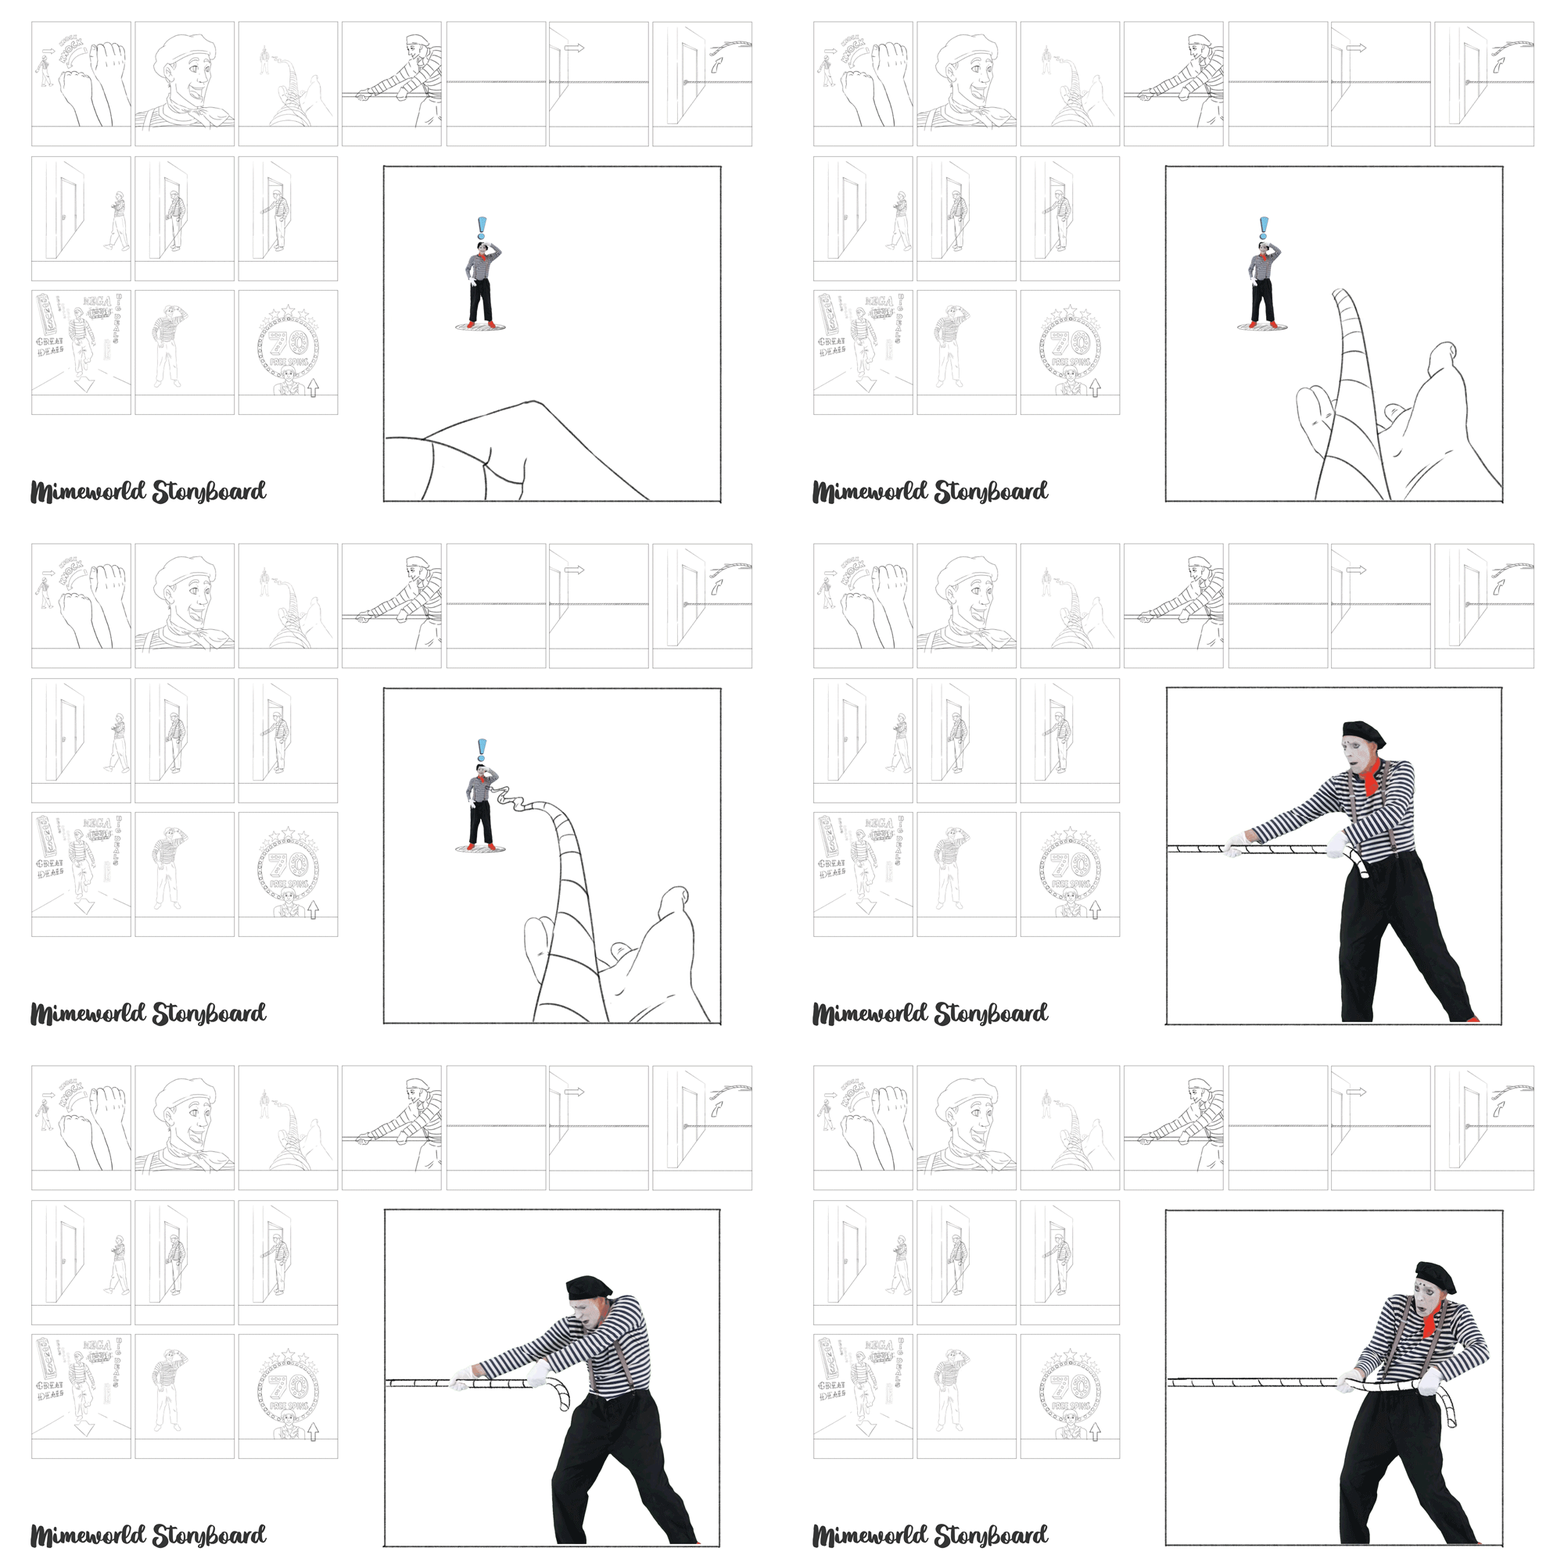
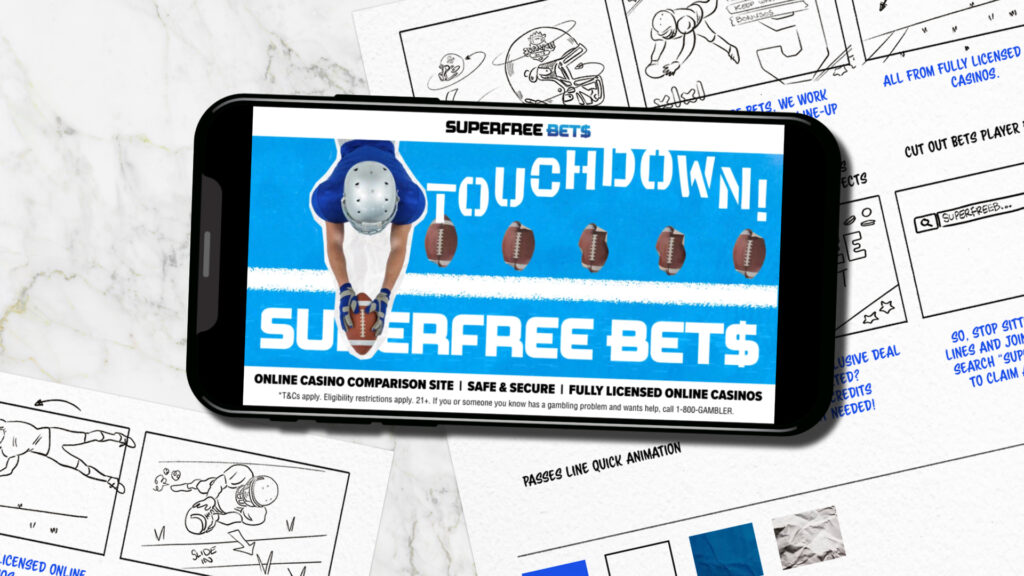
I still like to draw it first.
Storyboarding is basically the bit where I get to draw and call it planning. I love it. It is where I work out the sequence, framing, timing and little animated moments before I start building the final piece.
Design, data & creative systems
I built the system, not just the assets.
Creative was living across folders, spreadsheets, Jira tickets and people’s memory. Useful information had a habit of disappearing just when you needed it. So I brought it together.
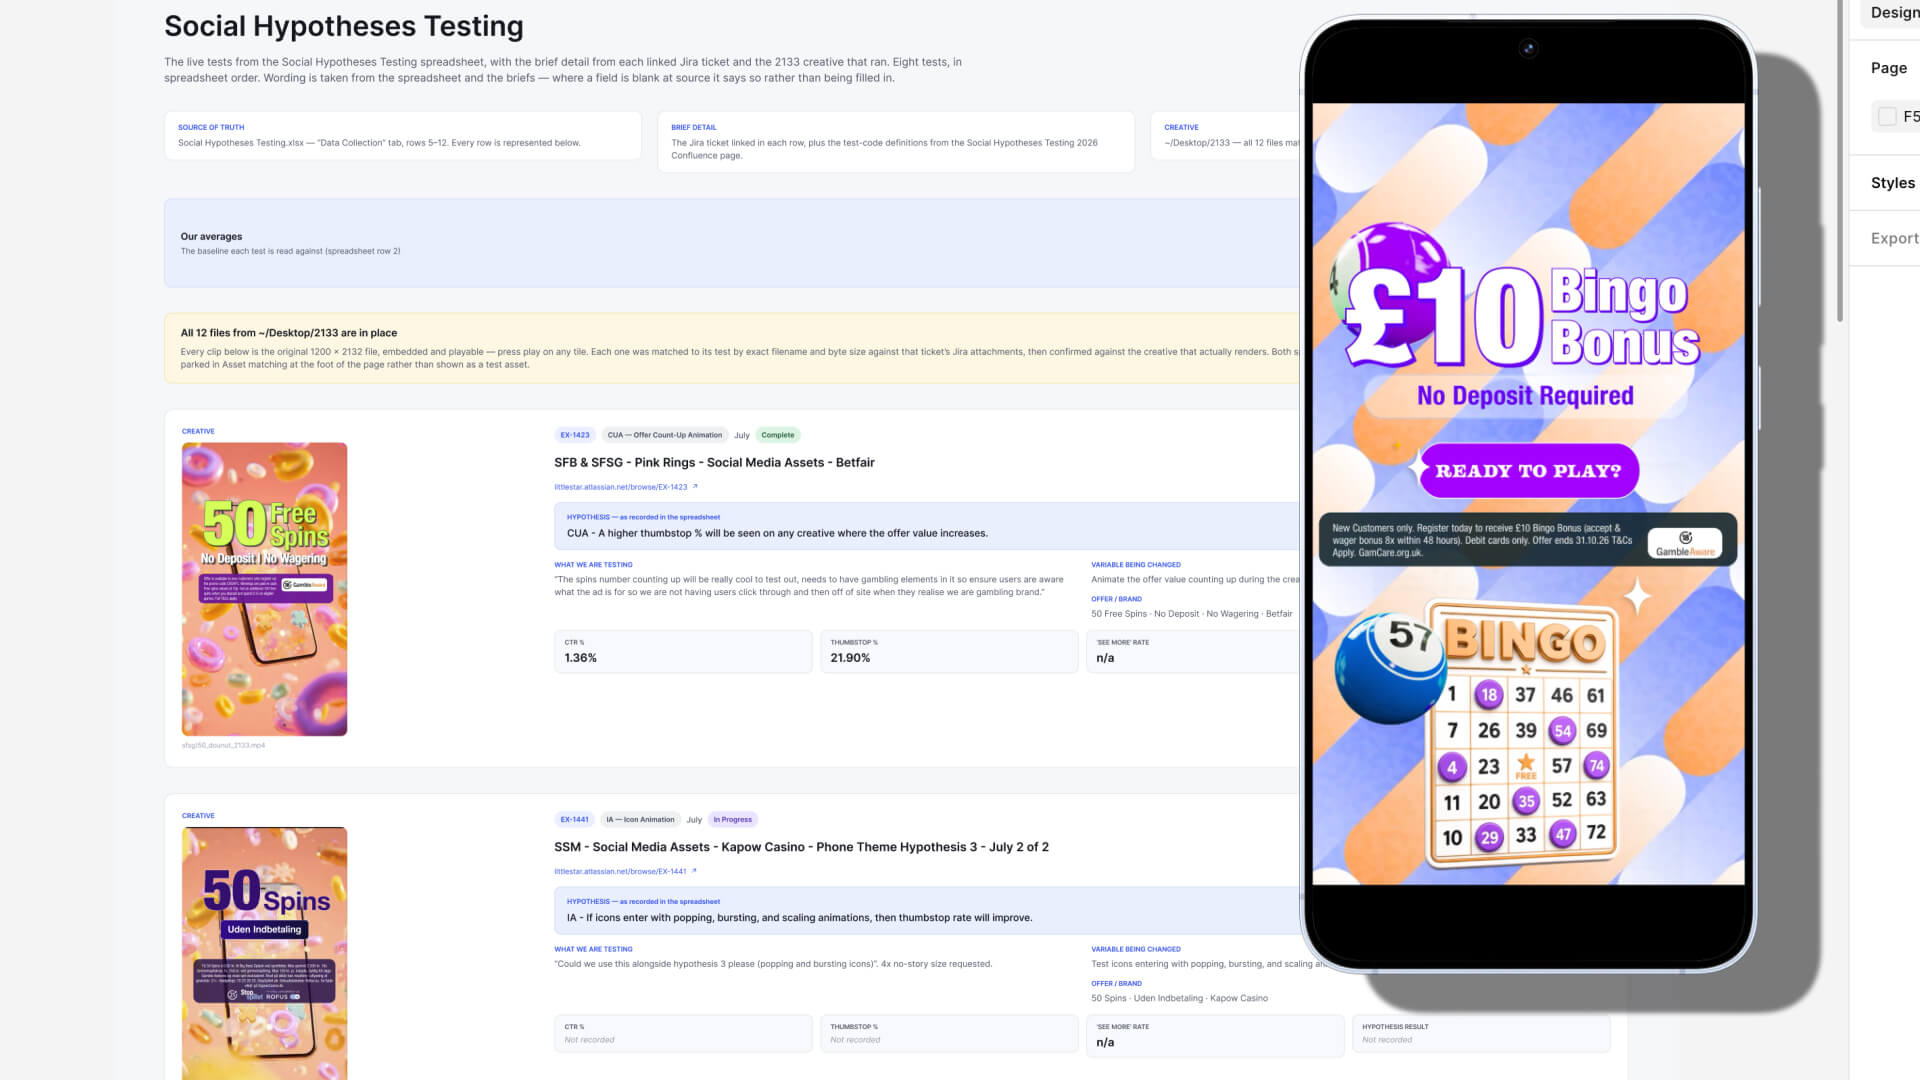
I created a searchable Figma library for social creative, competitor-analysis boards, hypothesis-testing pages and a data hub. It gave the team one place to see what we had made, what we had learned and what was worth testing next.
The numbers had somewhere to go.
I used thumb-stop rate, click-through rate, CPO, spend and creative fatigue to lead the next round of creative decisions.
Sometimes the answer was hiding in the first second of an animation. Sometimes it was the offer, the pacing or the whole idea. The important bit was making sure what we learned actually changed what we did next.
Better planning, fewer hunches.
The system became part of how I planned creative with marketing and the wider design team.
What is working? What is getting tired? What have we already tested? What are competitors doing? What should we make next?
Instead of starting every conversation from scratch, we had something useful to work from.
Conclusion
Make it. Measure it. Make it better.
That loop is probably the part I enjoy most. I get to make the work, see what happened, learn something from it and use that to shape the next idea. Design, motion and data all feed into each other.